This topic provides conceptual information about the annotations and interactions available on the igFinancialChart™ control including the different types of interaction layers available.
This topic contains the following sections:
Internally, interactions are implemented through interaction layers which are series that are added to the series collection. These layers are dependent on the cursor position. Adding the interaction layers to the igFinancialChart control disables the default behavior of the crosshairs and/or tooltips (depending on which type of layer added).
The default behavior is disabled because it prevents visual confusion as the interaction layers perform a similar visual function compared to the built in behavior as the cursor moves. You can, however, override this behavior and allow the default crosshair functionality to perform in addition to the interaction layer functionality. Also of note, only target a series by one tooltip layer at a time. If you target more than one tooltip layer at a series, the interaction layers that use tooltips will not function as expected. Using a tooltip for a series in more than one location at once is not allowed.
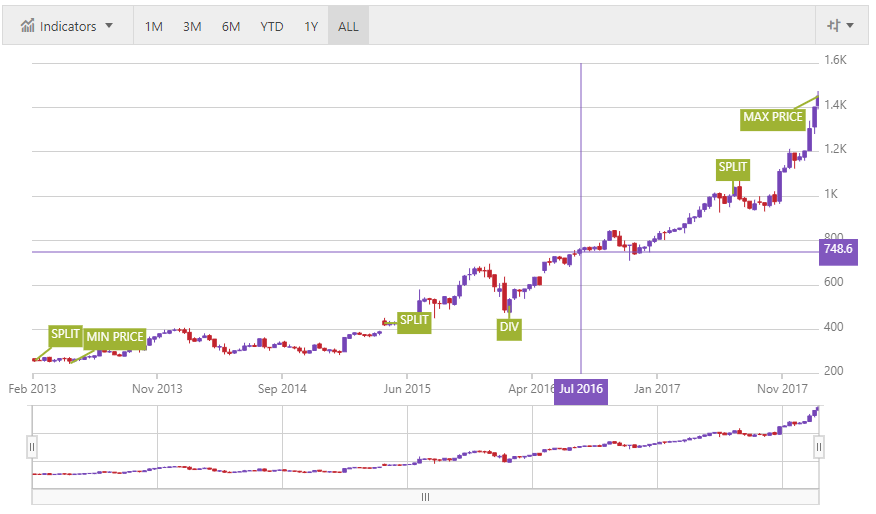
The following screenshot displays the igFinancialChart control with multiple layers enabled.

Currently there are 3 different hover interaction layers and 2 annotation layers available on the igFinancialChart control. Each of these interaction layers provides different hover and tooltip interactions that may be used individually or combined with one another providing powerful interactions.
The following table summarizes the different types of layers available on the igFinancialChart control.
The following topics provide additional information related to this topic:
View on GitHub