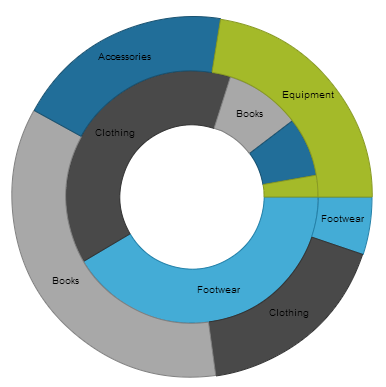
The topics in this group cover the igDoughnutChart™ control and its use.
The igDoughnutChart control allows for proportionally illustrating the occurrences of a variable. The inner radius of the control is configurable, and the Doughnut Chart’s series provides a built-in support for selecting and exploding its slices.

igDoughnutChart Overview: This topic provides an overall look at the igDoughnutChart control.
Adding igDoughnutChart: This is a group of topics demonstrating how to add the igDoughnutChart control to an HTML page and to an ASP.NET MVC application.
Configuring Selection and Explosion (igDoughnutChart): This topic explains how to configure selection and explosion for the slices of the igDoughnutChart.
jQuery and MVC API Links (igDoughnutChart): This topic provides links to the API documentation about the igDoughnutChart control and the Ignite UI for MVC for it.
Known Issues and Limitations (igDoughnutChart): This topic provides information on the igDoughnutChart control’s known issues and limitations.
View on GitHub