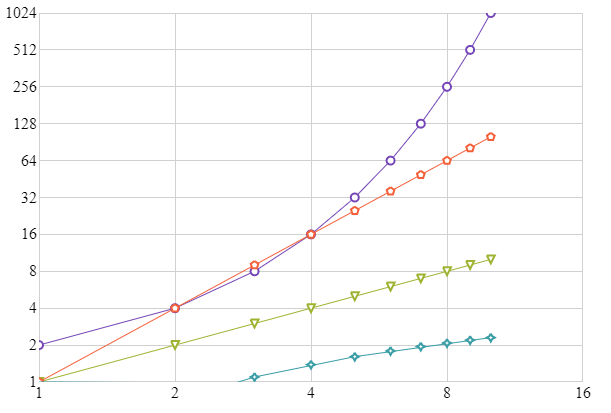
This topic covers the different scaling modes of the axes of the igShapeChart control, and is organized as follows:
In the igShapeChart control, both axes are numeric and allow scaling of data values using built-in scalers. This can be set by setting the IsLogarithmic property for each axis in the chart. Setting this property effectively sets the axis scaler to a linear or logarithmic mode for the particular axis it is set on.
The following table lists the properties that affect the scale of the axes in the igShapeChart control.
| Property Name | Property Type | Description |
|---|---|---|
xAxisIsLogarithmic, yAxisIsLogarithmic |
bool | Gets or sets whether the corresponding axis will use a logarithmic scale instead of a linear one. |
xAxisLogarithmBase, yAxisLogarithmBase |
number | Gets or sets the base value to use in the log function when mapping the position of data items along the corresponding axis. This property is effective only when the corresponding axis' IsLogarithmic property is set to true. |
The following code snippet shows how to use the built-in axis scalers to scale data values plotted in the igShapeChart control:
In HTML:
$(function () {
    $("#shapeChart").igShapeChart({
            dataSource: data,
            xAxisIsLogarithmic: true,
            xAxisLogarithmBase: 2,
            yAxisIsLogarithmic: true,
            yAxisLogarithmBase: 2
        });
    });
Using the above code will result in an igShapeChart that looks like the following when using an exponential, linear, quadratic, and logarithmic set of data items:

View on GitHub