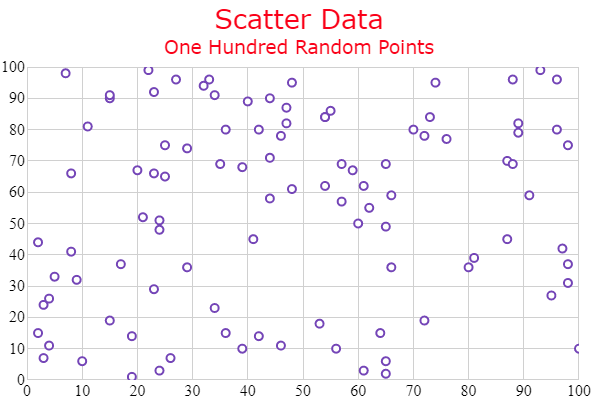
The title and subtitle feature of the igShapeChart control allows you to add information to the top section of the chart.
When adding a title or subtitle to the chart control, the content of the chart automatically resizes, allowing for the title and subtitle information.
This topic contains the following sections:
You can customize the look and feel of the igShapeChart control's title and subtitle in many different ways, such as applying different font styles, margins, and alignment. This can be achieved by using the following properties:
| Property Name | Property Type | Description |
|---|---|---|
title |
string | Gets or sets text to display above the plot area. |
titleAlignment |
enumeration | Gets or sets horizontal alignment which determines the title position, relative to the left and right edges of the control. |
titleBottomMargin |
number | Gets or sets the bottom margin of chart title. |
titleLeftMargin |
number | Gets or sets the left margin of chart title. |
titleRightMargin |
number | Gets or sets the right margin of chart title. |
titleTextColor |
string | Gets or sets color of chart title. |
titleTextStyle |
string | Gets or sets CSS font property for the chart title. |
titleTopMargin |
number | Gets or sets the top margin of chart title. |
The following code examples show how to customize the title and subtitle in the igShapeChart control:
In HTML:
$(function () {
    $("#shapeChart").igShapeChart({
            dataSource: data,
            title: "Scatter Data",
            titleTextColor: "Red",
            titleTextStyle: "20pt Verdana",
            subtitle: "One Hundred Random Points",
            subtitleTextColor: "Red",
            subtitleTextStyle: "14pt Verdana",
        });
    });
The above code will result in an igShapeChart that looks like the following:

View on GitHub