This topic explains, with code examples, how to configure the different brush properties in the igShapeChart control.
The following topics are prerequisites to understanding this topic:
The igShapeChart control has a few different properties for setting the different brushes for the series and the markers of those series in the chart. These different properties are detailed below.
| Property Name | Description |
|---|---|
Brushes |
Gets or sets a collection of brushes used to determine the palette for the major series fill or line in the chart. |
Outlines |
Gets or sets a collection of brushes used to determine the palette for the outlines of the series in the chart. This collection is useful for determining the primary series color when using Polyline and the stroke color for the Polygon ChartType enumerations. |
MarkerBrushes |
Gets or sets a collection of brushes used to determine the palette of the markers shown for the series in the chart. For marker-only ChartType enumerations such as Bubble and Point, this collection of brushes will make up the primary colors of the series. |
MarkerOutlines |
Gets or sets a collection of brushes used to determine the palette for the outer stroke of the markers shown for each series in the chart. For marker-only ChartType enumerations such as Bubble and Point, this collection of brushes will make up the outer stroke of the series. |
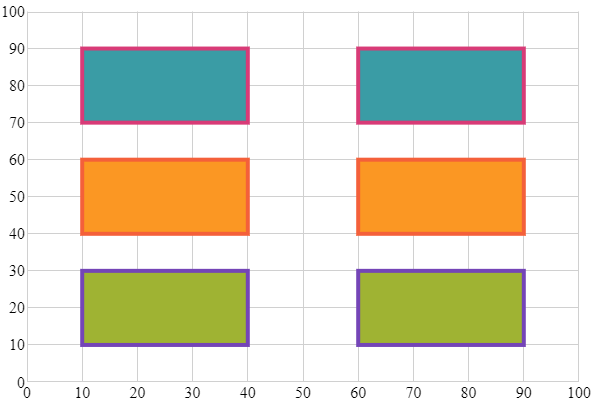
The following code example demonstrates usage of the Brushes and Outlines properties with the Polygon ChartType. The following collection is used as the data source for this code snippet:
In HTML:
<script>

    var data = [[GetRectShapes(10, 10)], [GetRectShapes(10, 40)], [GetRectShapes(10, 70)]];

    $(function () {
        $("#shapeChart").igShapeChart({
            chartType: "polygon",
            dataSource: data,
            brushes: ["#9FB328", "#FF9800", "#2E9CA6"],
            outlines: ["#7446B9", "#F96232", "#DC3F76"],
            thickness: 4,
            width: "600px",
            height: "400px",
            xAxisMinimumValue: 0,
            xAxisMaximumValue: 100,
            yAxisMinimumValue: 0,
            yAxisMaximumValue: 100,
        });
    });

    function GetRectShapes(x, y) {
        x = x || 0;
        y = y || 0;
        var shapes = [
        { "value": 5, "radius": 5, "x": x + 10, "y": y + 10, "points": [getRectPoints(x, y)] },
        { "value": 50, "radius": 50, "x": x + 40, "y": y + 10, "points": [getRectPoints(x + 50, y)] }];

        return shapes;
    }

    function getRectPoints(x, y) {
        return [
        { "x": x, "y": y },
        { "x": x + 30, "y": y },
        { "x": x + 30, "y": y + 20 },
        { "x": x, "y": y + 20 },
        { "x": x, "y": y }];
    }

</script>
Following the steps above will result in an igShapeChart control that looks like the following:

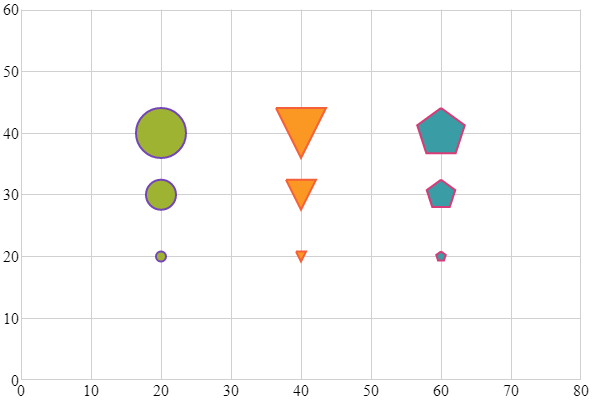
The following code example demonstrates usage of the MarkerBrushes and MarkerOutlines properties with the Bubble ChartType. The following collection is used as the data source for this code snippet:
In HTML:
<script>

    var data = [[GetBubbleData(20, 20, 10)], [GetBubbleData(40, 20, 10)], [GetBubbleData(60, 20, 10)]];

    $(function () {
        $("#shapeChart").igShapeChart({
            chartType: "bubble",
            dataSource: data,
            markerBrushes: ["#9FB328", "#FF9800", "#2E9CA6"],
            markerOutlines: ["#7446B9", "#F96232", "#DC3F76"],
            thickness: 4,
            width: "600px",
            height: "400px",
            xAxisMinimumValue: 0,
            xAxisMaximumValue: 80,
            yAxisMinimumValue: 0,
            yAxisMaximumValue: 60,
        });
    });

    function GetBubbleData(x, y, r)
    {
        var list = [
        { "X": x, "Y": y, "Radius": r },
        { "X": x, "Y": y+10, "Radius": r + 15 },
        { "X": x, "Y": y+20, "Radius": r + 30 }];

        return list;
    };

</script>
Following the steps above will result in an igShapeChart control that looks like the following:

View on GitHub