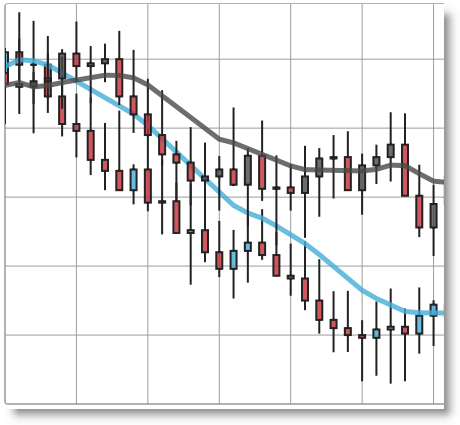
The igDataChart™ control provides functionality for displaying various kinds of charts in web applications based on the HTML5 Canvas element.

The topics in this section provide detailed information regarding the igDataChart control.
igDataChart Overview: This topic provides conceptual information about the igDataChart control including its main features, minimum requirements for using charts and user functionality.
Series Types (igDataChart): This topic shows all kinds of charts that can be produced with the help of the igDataChart control.
Configurable Visual Elements (igDataChart): This topic lists all configurable visual elements of the igDataChart control and the properties that manage them.
Adding igDataChart: This topic demonstrates how to add the igDataChart control to a page and bind it to data.
Binding igDataChart to Data: This topic explains how to bind the igDataChart control to various data sources (JavaScript array, IQueryable<T>, web service).
Series Requirements: This topic explains the specific requirements for each series.
Styling igDataChart: This topic explains how to use styles and apply themes with igDataChart.
Configuring the Axis Title (igDataChart): This topic provides information on setting an axis title on the igDataChart™ control.
Configuring the Chart Title and Subtitle (igDataChart): This topic provides information on using the chart title and subtitle feature of the igDataChart™ control.
Configuring Axis Intervals (igDataChart): This topic provides information on configuring the major and minor axis intervals on the igDataChart™ control.
Configuring Hover Interactions (igDataChart): This sections provides information about the hover interactions available on the igDataChart control including the different type of hover interactions layers available.
Configuring the Series Highlighting (igDataChart): This topic provides information on enabling the series highlighting feature along with a listing of the supported series.
Accessibility Compliance (igDataChart): This topic explains igDataChart accessibility features and provides advice how to achieve accessibility compliance for pages containing charts.
jQuery and MVC API Reference Links (igDataChart): This topic provides links to the API documentation for jQuery and Ignite UI for MVC class for igDataChart control.
Known Issues and Limitations (igDataChart): This topic lists all known issues and limitations in the igDataChart control.
The following topics provide additional information related to this topic.
Ignite UI for jQuery Overview: This topic provides general information about the Ignite UI for jQuery™ library.
igPieChart Overview: This topic provides conceptual information about the igPieChart™ control including its main features, minimum requirements, and user functionality.
View on GitHub