This topic explains how to bind the igDataChart™ control to various data sources (JavaScript array, IQueryable<T>, web service).
The following table lists the materials required as a prerequisite to understanding this topic.
Concepts
Topics
igDataSource Overview: General description of the igDataSource™ control which serves as an intermediate layer between the data bound controls and the actual data source.
igDataChart Overview: This topic provides conceptual information about the igDataChart control including its main features, minimum requirements for using charts and user functionality.
Adding igDataChart: This topic demonstrates how to create add the igDataChart control and bind it to data.
This topic contains the following sections:
The igDataChart control supports the following data sources:
| Data Source | Binding |
|---|---|
| igDataSource | Used internally by the control to manage data operations |
| IQueryable<T> | Used to supply data from an MVC controller method |
Each data source has different requirements for data binding to the igDataSource control. The following table lists each requirement category.
| Requirement category | Requirement listing |
|---|---|
| Data structure |
|
| Data types |
|
The data binding of the igDataChart control is identical to that of the other controls in the Ignite UI for jQuery™ library. The way to bind data is by either by assigning a data source to the dataSource option or by providing a URL in the dataSourceUrl if data is provided by a web or WCF service.
This procedure demonstrates how to bind the igDataChart control to a JavaScript data array.
To complete the procedure, you need the following:
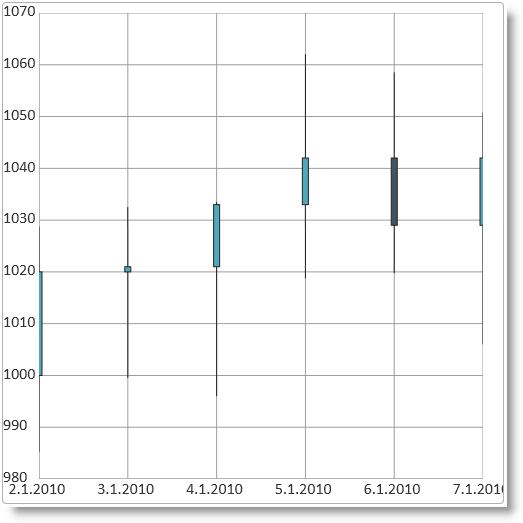
The following screenshot demonstrates the igDataChart control visualizing the data in the sample array as result of successful binding to that array.

The following steps demonstrate how to bind the igDataChart control to a JavaScript data array.
Define the data array.
The following code demonstrates defining a sample JavaScript array.
In Javascript:
 <script type="text/javascript">
     var data = [
         { "DateString": "2.1.2010", "Open": 1000, "High": 1028.75, "Low": 985.25, "Close": 1020, "Volume": 1995 },
         { "DateString": "3.1.2010", "Open": 1020, "High": 1032.5, "Low": 999.5, "Close": 1021, "Volume": 1964.5 },
         { "DateString": "4.1.2010", "Open": 1021, "High": 1033.5, "Low": 996, "Close": 1033, "Volume": 1974.75 },
         { "DateString": "5.1.2010", "Open": 1033, "High": 1062, "Low": 1018.75, "Close": 1042, "Volume": 1978.5 },
         { "DateString": "6.1.2010", "Open": 1042, "High": 1058.5, "Low": 1019.75, "Close": 1029, "Volume": 1979 },
         { "DateString": "7.1.2010", "Open": 1029, "High": 1050.75, "Low": 1006, "Close": 1042, "Volume": 1990 }
     ];
 </script>
Add and configure igDataChart control.
1. Add the chart div element to the web page.
In the body of the web page, add a div element for the igDataChart chart control.
In HTML:
 <body>
     ...
     <div id="chart"></div>
     ...
 </body>
2. Instantiate igDataChart chart control and configure the data source.
To do this, assign the data array defined in the previous step to the dataSource options of the igDataChart control.
In Javascript:
 <script type="text/javascript">
     $(function () {
         $("#chart").igDataChart({
             dataSource: data,
             axes: [{
                 type: "categoryX",
                 name: "xAxis",
                 label: "DateString",
             }, {
                 type: "numericY",
                 name: "priceAxis",
             }],
             series: [{
                 type: "financial",
                 name: "finSeries",
                 title: "Price Movements",
                 xAxis: "xAxis",
                 yAxis: "priceAxis",
                 openMemberPath: "Open",
                 lowMemberPath: "Low",
                 highMemberPath: "High",
                 closeMemberPath: "Close",
             }]
         });
     });
 </script>
This is a basic example of the data chart bound to JSON data:
This example demonstrates how to bind the igDataChart control to an XML string.
This procedure demonstrates how to bind a list of data objects from a backend controller method to a data chart using the ASP.NET helper provided in the Ignite UI for jQuery library.
To complete the procedure, you need the following:
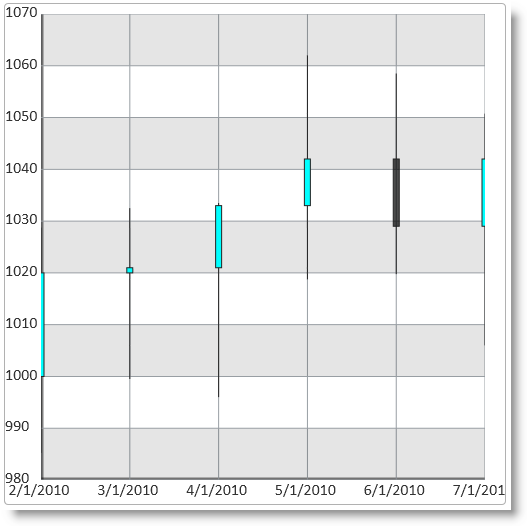
The following screenshot demonstrates the igDataChart control
visualizing the data in the sample array as result of successful binding
to that array.

The following steps demonstrate how to instantiate and bind an igDataChart control in ASP.NET MVC by providing a list of data objects to a strongly typed view and use Ignite UI for MVC DataChart.
Define the data model.
Define the data model class:
In C#:
 public class StockMarketDataPoint
 {
     public double Open { get; set; }
     public double High { get; set; }
     public double Low { get; set; }
     public double Close { get; set; }
     public double Volume { get; set; }
     public DateTime Date { get; set; }
     public string DateString { get { return Date.ToShortDateString(); } }
 }
Define the controller method.
Add the logic to a controller method in order to instantiate an array of StockMarketDataPoint objects. This place to add custom logic that gets data from the data base.
Note that the list of StockMarketDataPoint objects is converted to an IQueryable
In C#:
 public ActionResult Index()
 {
     List<StockMarketDataPoint> stockMarketData = new List<StockMarketDataPoint>
     {
         new StockMarketDataPoint { Date = DateTime.Parse("2.1.2010"), Open = 1000, High = 1028.75, Low = 985.25, Close = 1020, Volume = 1995 },
         new StockMarketDataPoint { Date = DateTime.Parse("3.1.2010"), Open = 1020, High = 1032.5, Low = 999.5, Close = 1021, Volume = 1964.5 },
         new StockMarketDataPoint { Date = DateTime.Parse("4.1.2010"), Open = 1021, High = 1033.5, Low = 996, Close = 1033, Volume = 1974.75 },
         new StockMarketDataPoint { Date = DateTime.Parse("5.1.2010"), Open = 1033, High = 1062, Low = 1018.75, Close = 1042, Volume = 1978.5 },
         new StockMarketDataPoint { Date = DateTime.Parse("6.1.2010"), Open = 1042, High = 1058.5, Low = 1019.75, Close = 1029, Volume = 1979 },
         new StockMarketDataPoint { Date = DateTime.Parse("7.1.2010"), Open = 1029, High = 1050.75, Low = 1006, Close = 1042, Volume = 1990 }
     };
     return View(stockMarketData.AsQueryable());
 }
Instantiate the igDataChart control and configure the data source.
The following code in the ASP.NET MVC view instantiates an igDataChart and assigns the list. Note how the data model of the strongly-typed view is mapped to the chart with the DataChart(Model) call. In the axes definition the item.DateString property is mapped to the category X-axis with the Label() function call. In the series definition the OpenMemberPath, CloseMemberPath, LowMemberPath and HighMemberPath calls bind the corresponding properties to the Financial chart type. The DataBind() method does the actual data binding and at the end the Render() method emits the final JavaScript code to be executed on the client-side.
In ASPX:
 <%@ Page Language="C#" Inherits="System.Web.Mvc.ViewPage<IQueryable<DataChartSample.Models.StockMarketDataPoint>>" %>
 <%@ Import Namespace="Infragistics.Web.Mvc" %>
 ...
 <%=
     Html.Infragistics().DataChart(Model)
         .ID("chart")
         .Axes(axes =>
             {
                 axes.CategoryX("xAxis").Label(item => item.DateString);
                 axes.NumericY("priceAxis");
             }
         )
         .Series(series =>
             {
                 series.Financial("finSeries")
                     .XAxis("xAxis")
                     .YAxis("priceAxis")
                     .OpenMemberPath(item => item.Open)
                     .CloseMemberPath(item => item.Close)
                     .LowMemberPath(item => item.Low)
                     .HighMemberPath(item => item.High);
             }
         )
         .DataBind()
         .Render()
 %>
This procedure shows how to bind an igDataChart to a WCF service with the help of the dataSourceUrl option. Binding to a Web service is identical.
To complete the procedure, you need the following:
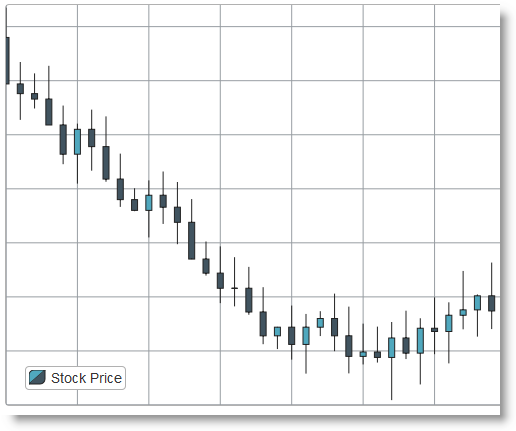
igDataChart see Adding igDataChart.The following screenshot demonstrates the igDataChart control
visualizing the data in the sample array as result of successful binding
to that array.

The following steps demonstrate how to bind an igDataChart control to a WCF service.
Define the WCF Service interface.
The full implementation of the WCF service is omitted because it is not relevant to the example. Here follows a sample service contract class and operation contract method that serves data to the client upon a GET HTTP request. The data model class is the same as in the previous procedure Bind to an IQueryable<T> in ASP.NET MVC.
Here follows the interface of the sample StockMarket WCF service that serves financial data to clients in the form of a List of StockMarketDataPoint objects.
In C#:
 [ServiceContract]
 [AspNetCompatibilityRequirements(RequirementsMode = AspNetCompatibilityRequirementsMode.Allowed)]
 public class StockMarket
 {
     [OperationContract]
     [WebGet(BodyStyle = WebMessageBodyStyle.Bare, ResponseFormat = WebMessageFormat.Json)]
     public List<StockMarketDataPoint> GetStockData()
     {
         return StockMarketGenerator.GenerateData();
     }
 }
The important things to note here is the WebGet attribute applied to the server method GetStockData(). It declares that this method will respond to GET requests and that the response will be a bare (not wrapped) JSON encoded array of data.
Instantiate chart control and set data source.
HTML/jQuery
Add the following code into the head part of your HTML5 page in order to instantiate an igDataChart. The WCF service address is set as data source by assigning the address to the dataSourceUrl option. In the x-axis definition the axis labels is mapped to the DateString property of the data provided by the server. Identically, the data options of the financial data series are mapped to the Open, High, Low and Close properties of the WCF data source.
In this example it is assumed that the WCF service is installed and running on the address http://www.example.com/Services/StockMarket.svc/GetStockData.
In Javascript:
 $(function () {
     $("#chart").igDataChart({
         dataSourceUrl: "http://www.example.com/Services/StockMarket.svc/GetStockData",
         axes: [{
             name: "xAxis",
             type: "categoryX",
             label: "DateString"
         },
         {
             name: "yAxis",
             type: "numericY"
         }],
         series: [{
             name: "dataSeries",
             title: "stockPrice",
             type: "financial",
             xAxis: "xAxis",
             yAxis: "yAxis",
             openMemberPath: "Open",
             highMemberPath: "High",
             lowMemberPath: "Low",
             closeMemberPath: "Close"
         }]
     });
 });
ASP.NET MVC
Add the following code into your ASP.NET MVC view in order to instantiate an igDataChart and set the WCF service address. The meaning of the code is the same as in the HTML example and the important piece of code is the call that sets the WCF service URL: DataSourceUrl("http://www.example.com/Services/StockMarket.svc/GetStockData").
In ASPX:
 <%@ Page Language="C#" Inherits="System.Web.Mvc.ViewPage<dynamic>" %>
 <%@ Import Namespace="Infragistics.Web.Mvc" %>
 ...
 <%=
     Html.Infragistics().DataChart()
         .ID("chart")
         .Axes((axes) =>
             {
                 axes.CategoryX("xAxis").Label("DateString");
                 axes.NumericY("yAxis");
             })
         .Series((series) =>
             {
                 series
                 .Financial("finSeries")
                 .XAxis("xAxis").YAxis("yAxis")
                 .OpenMemberPath("Open")
                 .CloseMemberPath("Close")
                 .LowMemberPath("Low")
                 .HighMemberPath("High")
                 .VolumeMemberPath("Volume")
             })
         .DataSourceUrl("http://www.example.com/Services/StockMarket.svc/GetStockData")
         .DataBind()
         .Render()
 %>
The following topics provide additional information related to this topic.
Binding igDataSource to Client-Side Data: This topic explains how to bind igDataSource to client-side JavaScript arrays and JSON data.
Binding igDataSource to REST Services: This topic explains how to bind an igDataSource control to REST services.
Binding igDataSource to WCF Data Services: This topic explains how to bind an igDataSource component to a WCF service.
The following samples provide additional information related to this topic.
igDataChart.The following material (available outside the Infragistics family of content) provides additional information related to this topic.
Hosting and Consuming WCF Services: This MSDN article explains in detail how to create, host and consume WCF services.
Walkthrough: Creating and Using an ASP.NET Web Service in Visual Web Developer: This MSDN article explains in detail how to create a Web Service in Visual Web Developer.
View on GitHub