This topic provides conceptual information about the igPivotDataSelector™ control including its main features, minimum requirements, and user functionality.
The following table lists the topics and concepts required as a prerequisite to understanding this topic.
Topics
External Resources
This topic contains the following sections:
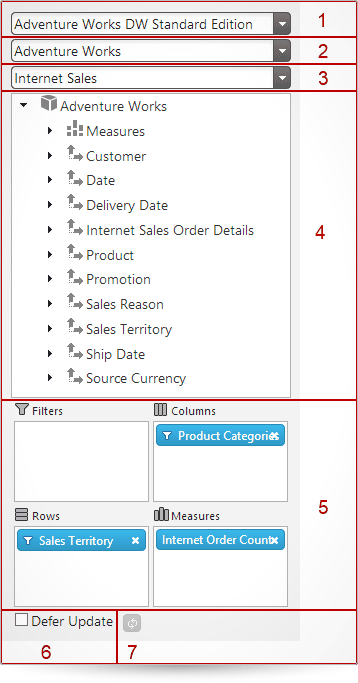
igPivotDataSelector is an interactive UI control (jQuery UI widget) that enables users to select data slices, typically, when data is being visualized in an igPivotGrid™. It is a supplementary control working together with the data source components. The igPivotDataSelector control comprises:

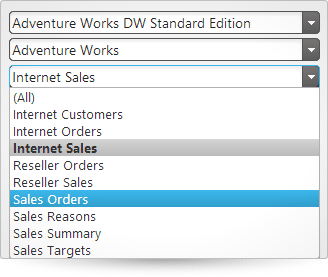
Here is the typical manner in which the user operates the igPivotDataSelector control: when the user selects a database and cube from a drop-downs, the metadata tree with all available dimensions loads along with the respective hierarchies and measures. If igOlapXmlaDataSource is used, the tree loads upon user selection; if igOlapFlatDataSource™ is used or a database and cube have been set in advance, the tree will load when the igPivotDataSelector is initialized. This way, the igPivotDataSelector provides an interactive UI component to select a database to connect to (if you are using database data), cube to extract data from, and a measure group to use.
The igPivotDataSelector is placed directly on the page using a div element, just like most data visualization controls.
The following table summarizes the main features of the igPivotDataSelector control.
| Feature | Description |
|---|---|
| Data Selection | Given a data source, the igPivotDataSelector provides drop-downs to select a database to connect to (if you are using database data), cube to extract data from, and a set of measure groups. |
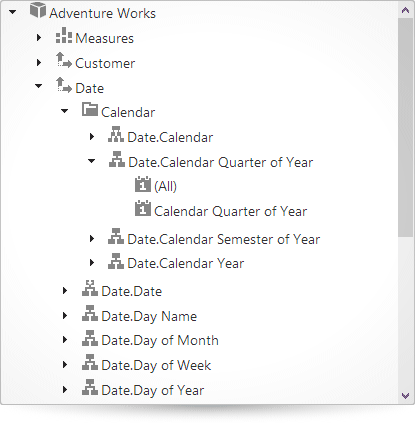
| Metadata Tree | All the available dimensions with their respective hierarchies along with a list with all the available measures are loaded in a tree once the user chooses a database, cube, and measure group. When the user selects a Measure group, the measures are filtered accordingly. If none is selected, all measures will be available in the metadata tree. When the user selects a Measure group, the measures are filtered accordingly. If none is selected, all measures will be available in the metadata tree. |
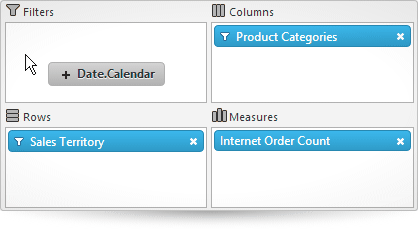
| Slice Interaction | Unless custom restrictions are applied, all available hierarchies from the tree can be drag-and-dropped to one of the following areas: Rows, Columns, Filters. All available measures from the tree can be drag-and-dropped to the Measures area. |
| Deferred Update | The igPivotDataSelector supports two data source update modes based on when the data source gets updated after the user makes a change in the control:
igPivotDataSelector, the user can control the refresh mode through the Defer Update checkbox and, if the box is checked, manually refresh the data source at their discretion by pressing the update button. |
| Support for interaction with other Ignite UI for jQuery controls | igPivotDataSelector uses the same data source instance as other Ignite UI for jQuery controls, such as igPivotGrid. This enables you to build complete OLAP data visualization applications. (You can use the igPivotView control which has similar purpose.) |
The following table summarizes the user interaction capabilities of the igPivotDataSelector control.
| The user can… | Using… | Details | Configurable? |
|---|---|---|---|
Change database, cube, and measure group (igOlapXmlaDataSource only) |
The data selector combo boxes. | You can set up initial the database, cube and measure group programmatically using the catalog, cube, and measureGroup properties of the igOlapXmlaDataSource framework. |
 |
| Browse data source dimensions and measures | The metadata tree control. | The user can see all available, dimensions, measures, hierarchies and levels. |  |
| Select hierarchies for the rows, columns, and filters | Perform drag-and-drop from the tree to the rows, columns and filters areas. | Unless custom restrictions are set in place, the user can drag all the hierarchies available in the metadata tree to one of the rows, columns, or filters areas. |  |
| Select measures | Perform drag-and-drop from the tree to the measures area. | Unless custom restrictions are set in place, the user can drag all the measures available in the metadata tree to the measures area. |  |
| Filter the members in a hierarchy | Using the filter menu for each hierarchy that is added to the rows, columns, or filters. | After an item is added to an area, it can be removed by the user.For hierarchies, a filter menu is available where members of the hierarchy can be expanded/collapsed or selected/unselected, thus adding/removing the member to/from the result. |  |
| Enable/Disable Deferred Update | Checking/unchecking the Deferred Update checkbox | - |  |
| Update the grid on demand if Deferred Update is enabled | By clicking the Update Layout button ( ). ). |
- |  |
Because the igPivotDataSelector control is a jQuery UI widget, it depends on jQuery and jQuery UI libraries. The Modernzr library is also used internally for detecting browser and device capabilities. The control uses several Ignite UI for jQuery shared resources for its functionality. References to these resources are needed nevertheless, in spite of pure jQuery or Ignite UI for MVC being used. The Infragistics.Web.Mvc assembly is required when the control is used in the context of ASP.NET MVC.
For a detailed list of the required resources for using the igPivotDataSelector control, refer to the Adding igPivotDataSelector to an HTML Page topic.
The following topics provide additional information related to this topic.
Adding igPivotDataSelector to an HTML Page: This topic demonstrates how to add the igPivotDataSelector to an HTML page.
jQuery and MVC API Links (igPivotDataSelector): This topic lists links to the API documentation about the igPivotDataSelector and its ASP.NET MVC Helper.
The following samples provide additional information related to this topic.
Binding to Xmla Data Source: This sample demonstrates how to bind the igPivotGrid to an igOlapXmlaDataSource and uses an igPivotDataSelector for data selection.
Using the ASP.NET MVC Helper with Xmla Data Source: This sample demonstrates how to use the ASP.NET MVC Helper for the igOlapXmlaDataSource and how to use this data source in igPivotDataSelector and igPivotGrid.
Remote Xmla Provider: This sample demonstrates one of the benefits of using the remote provider feature of the igOlapXmlaDataSource - less network traffic. All requests are proxied through the server application to avoid cross domain problems. In addition, the data is translated to JSON reducing the size of the response.
View on GitHub