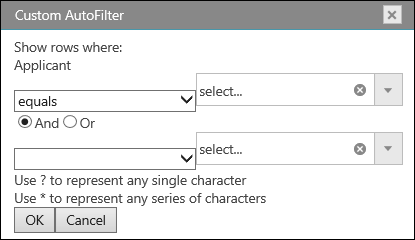
This topic explains what operations can be performed by the user with the control’s filter dialog to create or modify complex filters in a column.
To understand this topic you need to be familiar with the concept and topics related to the Infragistics JavaScript Excel Library and igSpreadsheet.
This topic contains the following sections:

The {SpreadsheetName} control provides a filter dialog which is opened by clicking on the dropdown button in the header row of either a loaded worksheet or created table. The filter dialog will change based on the field that was interacted with.
The following example code demonstrates how to show the filter dialog for the first relative column in a worksheet region's filter settings. A region can be assigned with the SetRegion method exposed from the Worksheet.FilterSettings.
var executed = $(".selector").igSpreadsheet("showFilterDialogForWorksheet", 0);
The following example code demonstrates how to show the filter dialog for the first column in a worksheet table, specified by it's index.
var executed = $(".selector").igSpreadsheet("showFilterDialogForTable", table.columns(0));
View on GitHub