
Markers are visual elements that display the values of data points in the igCategoryChart™ control's plot area. Markers help your end-users immediately identify a data point's value even if the value falls between major or minor grid lines. This section provides you with useful information about working with the igCategoryChart control's Markers.
The appearance of chart markers is managed through the marker properties of the igCategoryChart class.
The following table lists all marker appearance properties.
| Property Name | Property Type | Description |
|---|---|---|
markerTypes |
MarkerType | Determines type of markers displayed by the all series in the chart |
markerBrushes |
Brush | Determines fill color of markers |
markerOutlines |
Brush | Determines outline color of markers |
| Property Name | Property Type | Description |
|---|---|---|
circleMarker |
MarkerType | Displays the Circle marker type. |
diamondMarker |
MarkerType | Displays the Diamond marker type. |
hexagonMarker |
MarkerType | Displays the Hexagon marker type. |
hexagramMarker |
MarkerType | Displays the Hexagram marker type. |
pentagramMarker |
MarkerType | Displays the Pentagram marker type. |
pentagonMarker |
MarkerType | Displays the Pentagon marker type. |
pyramidMarker |
MarkerType | Displays the Pyramid marker type. |
squareMarker |
MarkerType | Displays the Square marker type. |
tetragramMarker |
MarkerType | Displays the Tetragram marker type. |
triangleMarker |
MarkerType | Displays the Triangle marker type. |
The code snippets below demonstrate how to change the marker type for the igCategoryChart.
In HTML:
$(function () {
     $(“chart1”).igCategoryChart({
         markerTypes: [“diamond, "circle”, "square"]
     });
});
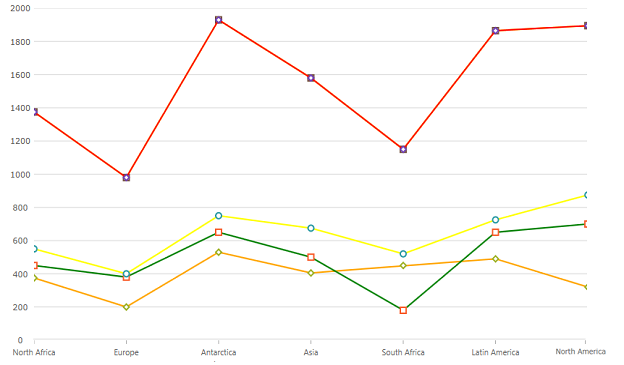
The following screenshot displays the igCategoryChart control using the Line chart type with Diamond markers.
The code snippets below demonstrate how to change the markerBrushes and markerOutlines for the igCategoryChart.
In HTML:
$(function () {
     $(“chart1”).igCategoryChart({
        markerBrushes: [“White”],
        markerOutlines: [“Red”, “Orange”, “Green”]
     });
});
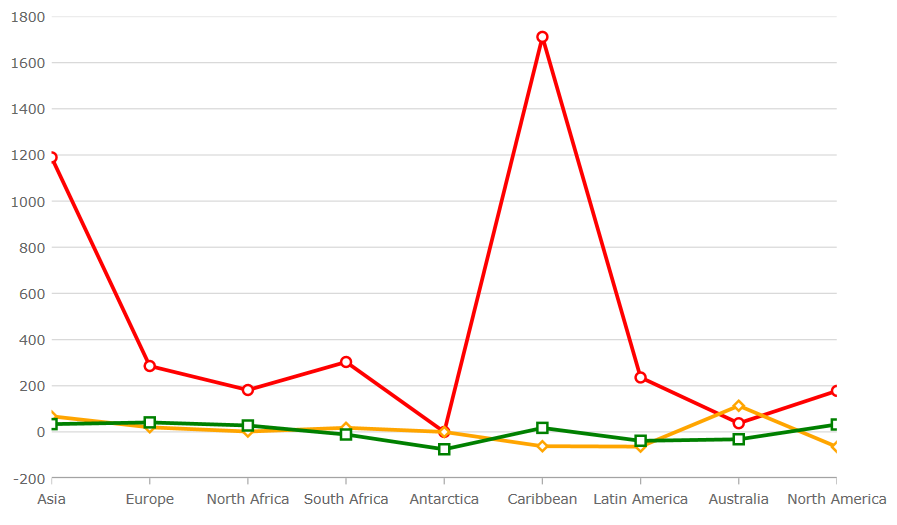
The following screenshot displays the igCategoryChart control using the Line chart type with customized markers.
View on GitHub