This topic explains, with code examples, how to disable the default tooltips in the igFinancialChart control and how to create custom ones.
In the igFinancialChart control, tooltips are displayed as long as the mouse cursor hovers over a series in the igFinancialChart control.
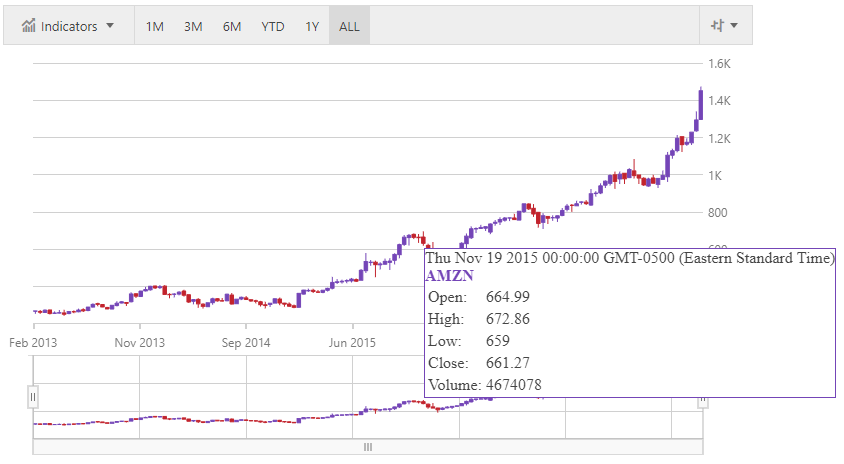
The igFinancialChart control provides default tooltips for each series of data. The default tooltips display all the information relevant to the particular item (time, open, high, low, close, and volume) and are styled to match the series' style. Default tooltips are displayed by setting the TooltipType property to Default.
If default tooltips are not sufficient, custom tooltips can be configured as well. Tooltips can be customized in the following aspects:
Tooltip content
Tooltip look-and-feel
When using Default tooltips the structure of the tooltip may be customized by providing an ID string of a template element to the tooltipTemplate option of the igFinancialChart control.
The following screenshot demonstrates the default tooltip for the igFinancialChart.

This example demonstrates how to display tooltip information about the open, high, low, and close sales volumes for any data point.

Figure 1: The igFinancialChart control with custom tooltip.
Add a custom style for the chart’s tooltip.
In HTML:
<script id="chartTooltip" type="text/tmpl">
    <div class="ui-chart-tooltip">
        <div>${series.title}</div>
        <div>${item.time}</div>
        <div>Open: ${item.open}</div>
        <div>High: ${item.high}</div>
        <div>Low: ${item.low}</div>
        <div>Close: ${item.close}</div>
        <div>Volume: ${item.volume}</div>
    </div>
</script>
Set the custom tooltip style to the igFinancialChart control.
In JavaScript:
$("#chart").igFinancialChart({
    dataSource: data,
    tooltipTemplate: "chartTooltip"
});To disable the tooltips, you should provide an empty tooltipTemplate so the tooltip will not display.
In HTML:
<script id="chartTooltip" type="text/tmpl">
</script>View on GitHub