
This topic provides information for enabling and using the selection feature in the igPieChart™ control.
This topic contains the following sections:
This article assumes you have already read the Data Binding topic, and uses the code therein as a starting point.
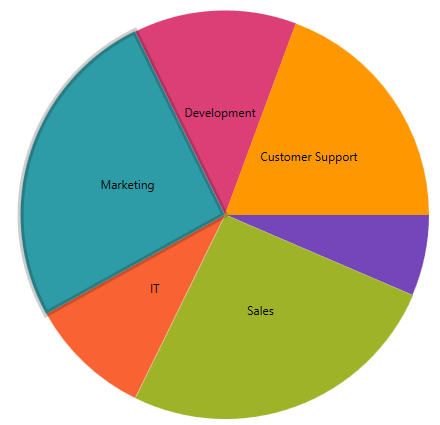
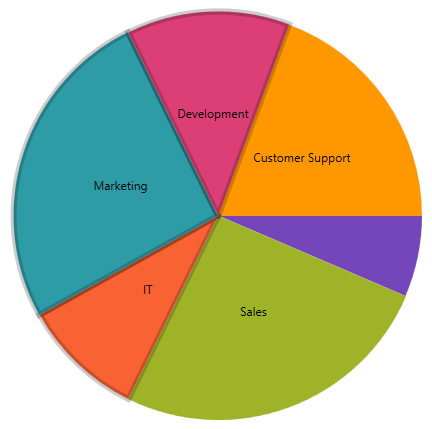
The Pie Chart supports slice selection by mouse click as the default behavior. You can determine the selected slices by using the 'selectedItem' option. The selected slice is highlighted as demonstrated in the following image:
There is an option called selectionMode which is how you set what mode you want the pie chart to use. The default is “Single”. In order to disable selection, set the property to “Manual”.
The following code snippet demonstrates how to disable selection.
In Javascript:
$(function () {
    $("#chart").igPieChart({
        dataSource: data,
        dataValue: "Pop2008",
        dataLabel: "CountryName",
        labelsPosition: "bestFit",
        selectionMode: "manual",
    }
});
The pie chart supports three different selection modes.
When the mode is set to single, only one slice can be selected at a time. When you select a new slice the previously selected slice will be deselected and the new one will become selected.
when the mode is set to Multiple, many slices can be selected at once. If you click on a slice, it will become selected and clicking on a different slice will also select that slice leaving the previous slice selected.
When the mode is set to Manual, selection is disabled.
The pie chart has 4 events associated with selection:
selectedItemChangingselectedItemChangedselectedItemsChangingselectedItemsChangedThe events that end in “Changing” are cancelable events which means you can stop the selection of a slice by setting the event argument property “Cancel” to true. When set to true the associated property will not update and the slice will not become selected. This is useful for scenarios where you want to keep users from being able to select certain slices based on the data inside it.
In Javascript:
$(function () {
    $("#chart").igPieChart({
        dataSource: data,
        dataValue: "Pop2008",
        dataLabel: "CountryName",
        labelsPosition: "bestFit",
        selectedItemChanging: function (evt, ui) {
            ui.cancel;
        }
    }
});
For scenarios where you click on the Others slice, the pie chart will return an object called pieSliceOthersContext. This object contains a list of the data items contained within the Others slice.
Data Binding (igPieChart): This topic explains how to bind various data sources to the igPieChart™ control.
jQuery and MVC API Reference Links (igPieChart): This topic provides links to the API documentation for jQuery and Ignite UI for MVC class for igDataChart™ control.
Styling igPieChart with Themes: Demonstrates using styles and applying themes with igPieChart™.
View on GitHub