Version

Custom Indicators

The igFinancialChart control allows you to define custom financial indicators to display in the Indicator Pane.

In this topic

This topic contains the following sections:

Configuring Custom Indicators

In the igFinancialChart, you can enable custom financial indicators by adding names for them to the customIndicatorNames property and performing calculations for them in the applyCustomIndicators event.

Code Snippet

The following code example shows how to display a custom indicator displaying random values:

In JavaScript:

$(".selector").igFinancialChart({
    dataSource: data,
    customIndicatorNames: ["Open Price"],
    applyCustomIndicators: function (e, ui) {
        var ds = ui.indicatorInfo.getDataSource();
        for (var i = 0; i < ds.indicatorColumn.length; i++) {
            ds.indicatorColumn[i] = ds.openColumn[i];
        }
    }
});
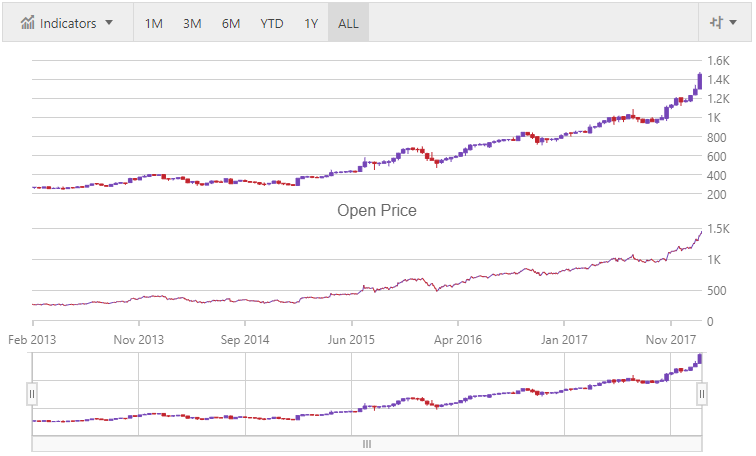
financialchart jquery custom indicators.png

Related Content

View on GitHub