
In the igShapeChart control, both the axes are numeric. The range on these numeric axes is the difference in numeric values from the beginning of the axis to the end, or from the smallest to largest values in the underlying data. The range minimum is the lowest value of the axis. The range maximum is the highest value of the axis.
By default, the igShapeChart control will calculate the minimum and maximum values for the X and Y axis range based on the lowest and highest data points in the underlying data source in order to maximize the chart plot area. This automatic calculation of an axis' minimum and maximum values may not be appropriate for your set of data points. For example, if you wanted to show some extra space between the edge of the chart and your plotted series, you would need to format the axis range in the igShapeChart.
You can format the ranges of the igShapeChart control's axes by setting the xAxisMinimumValue, xAxisMaximumValue, yAxisMinimumValue, and yAxisMaximumValue properties on the chart. This will set the axis ranges to the values that you define, allowing you to display your data at the range that you desire.
The following sample code demonstrates how to change the axis range on the X and Y axes of the igShapeChart control.
In HTML:
<script>
var data = [
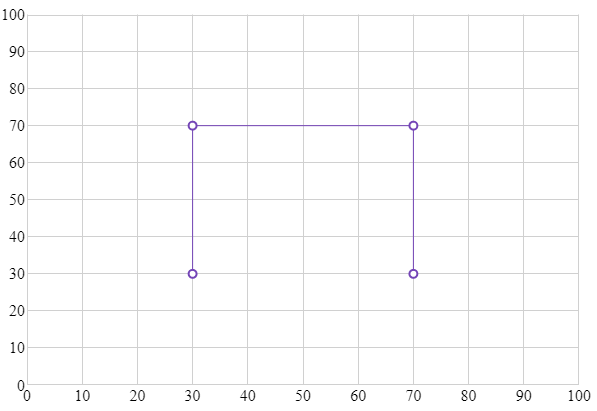
{ "X": 30, "Y": 30},
{ "X": 30, "Y": 70},
{ "X": 70, "Y": 70},
{ "X": 70, "Y": 30}];
$(function () {
$("#shapeChart").igShapeChart({
dataSource: data,
width: "600px",
height: "400px",
xAxisMinimumValue: 0,
yAxisMinimumValue: 0,
xAxisMaximumValue: 100,
yAxisMaximumValue: 100,
});
});
</script>
Following the steps above will result in an igShapeChart control that looks like the following:
View on GitHub