
Markers are visual elements that display the values of data points in the igShapeChart control's plot area. Markers help your end-users immediately identify a data point's value even if the value falls between major or minor grid lines. This section provides you with useful information about working with the igShapeChart control's Markers.
| Topic | Purpose |
|---|---|
| igShapeChart Overview | This topic provides conceptual information about the igShapeChart control including its main features, minimum requirements, and user functionality. |
| Getting Started with igShapeChart | This topic explains how to bind data to the igShapeChart control. |
Note, Polygon displays its markers in the center of the shapes, defined by points, whereas the other chart types render its markers at X/Y coordinates of data items.
The following table lists all marker properties.
| Property Name | Property Type | Description |
|---|---|---|
markerTypes |
enumeration | Determines type of markers displayed by the all series in the chart |
markerBrushes |
object | Determines fill color of markers |
markerOutlines |
object | Determines outline color of markers |
markerMaxCount |
number | Determines the maximum number of markers displyed in the plot area of the chart |
| Property Name | Property Type | Description |
|---|---|---|
circleMarker |
enumeration | Displays the Circle marker type. |
diamondMarker |
enumeration | Displays the Diamond marker type. |
hexagonMarker |
enumeration | Displays the Hexagon marker type. |
hexagramMarker |
enumeration | Displays the Hexagram marker type. |
pentagramMarker |
enumeration | Displays the Pentagram marker type. |
pentagonMarker |
enumeration | Displays the Pentagon marker type. |
pyramidMarker |
enumeration | Displays the Pyramid marker type. |
squareMarker |
enumeration | Displays the Square marker type. |
tetragramMarker |
enumeration | Displays the Tetragram marker type. |
triangleMarker |
enumeration | Displays the Triangle marker type. |
autoMarker |
enumeration | Displays one marker type from above list for each series rendered in the chart. |
noneMarker |
enumeration | Hides markers for a given series. |
The code snippets below demonstrate how to change the marker type for the igShapeChart.
In HTML:
$(function () {
     $(“chart1”).igShapeChart({
         markerTypes: [“diamond, "circle”, "square"]
     });
});
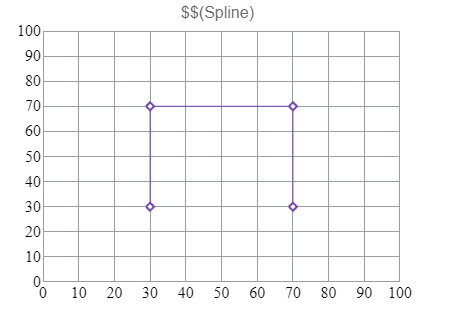
The following screenshot displays the igShapeChart control using the Line chart type with Diamond markers.
The code snippets below demonstrate how to change the markerBrushes and markerOutlines for the igShapeChart.
In HTML:
$(function () {
     $(“chart1”).igShapeChart({
        markerBrushes: [“White”],
        markerOutlines: [“Red”, “Orange”, “Green”],
        markerTypes: [“diamond", "circle”, "square"]
     });
});
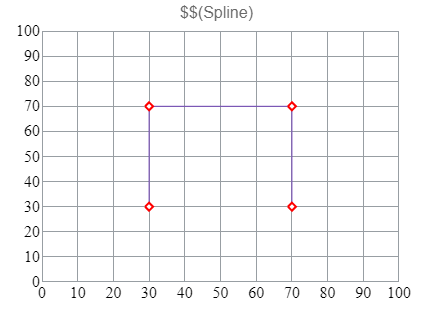
The following screenshot displays the igShapeChart control using the Line chart type with customized markers.
View on GitHub