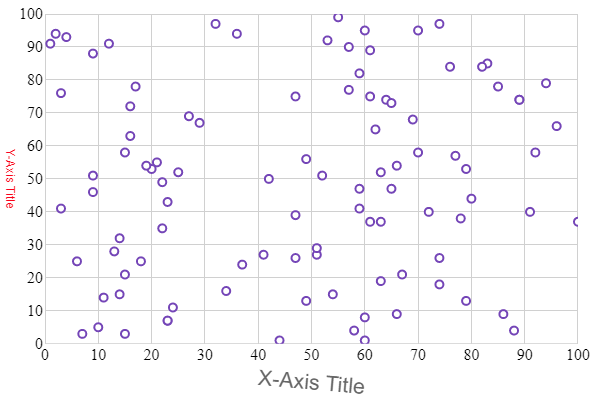
This topic provides information on configuring the x-axis and y-axis titles in the igShapeChart control.
This topic contains the following sections:
You can customize the look and feel of the igShapeChart control's x-axis and y-axis titles in many different ways, such as applying different font styles, margins, and alignment. This can be achieved by utilizing the following properties:
| Property Name | Property Type | Description |
|---|---|---|
xAxisTitle, yAxisTitle |
string | Gets or sets the Text to display below the X-Axis or to the Left of the Y-Axis. |
xAxisTitleAlignment, yAxisTitleAlignment |
enumeration | Gets or sets Horizontal alignment of the X-axis title or the Vertical alignment of the Y-Axis title. |
xAxisTitleAngle, yAxisTitleAngle |
number | Gets or sets the angle of rotation for the corresponding axis title. |
xAxisTitleBottomMargin, yAxisTitleBottomMargin |
number | Gets or sets the bottom margin of a title on the corresponding axis. |
xAxisTitleLeftMargin, yAxisTitleLeftMargin |
number | Gets or sets the left margin of a title on the corresponding axis. |
xAxisTitleMargin, yAxisTitleMargin |
number | Gets or sets the margin around a title on the corresponding axis. |
xAxisTitleRightMargin, yAxisTitleRightMargin |
number | Gets or sets the right margin of a title on the corresponding axis. |
xAxisTitleTextColor, yAxisTitleTextColor |
string | Gets or sets color of title on the corresponding axis. |
xAxisTitleTextStyle, yAxisTitleTextStyle |
string | Gets or sets CSS font property for title on the corresponding axis. |
xAxisTitleTopMargin, yAxisTitleTopMargin |
number | Gets or sets the top margin of a title on the corresponding axis. |
The following code example shows how to style the titles on the igShapeChart axes using some of the properties mentioned above:
In HTML:
$(function () {
    $("#shapeChart").igShapeChart({
            dataSource: data,
            xAxisTitle: "X-Axis Title",
            xAxisTitleTextStyle: "16pt Arial",
            xAxisTitleAngle: 5,
            yAxisTitle: "Y-Axis Title",
            yAxisTitleTextColor: "Red",
            yAxisTitleAngle: 90,
        });
    });
The following screenshot demonstrates the igShapeChart control with the titles styled using the above code snippet:

View on GitHub